Why think of land this way
When we think of land we think of land we typically just think about the amount of money that it costs to buy a piece of land. Tax assessors think about how much money the land and the buildings on it are worth. At the same time cities think about it in the sense of how much does it cost to maintain their infrastructure.
Given all of these factors comparing we should actually compare how much land and its people and infrastructure using it will cost the city. When we think about the modern American city we think of a small dense area for "business" and a commuting population that flocks to it. While this was true in a pre-pandemic world its truth is being questioned today.
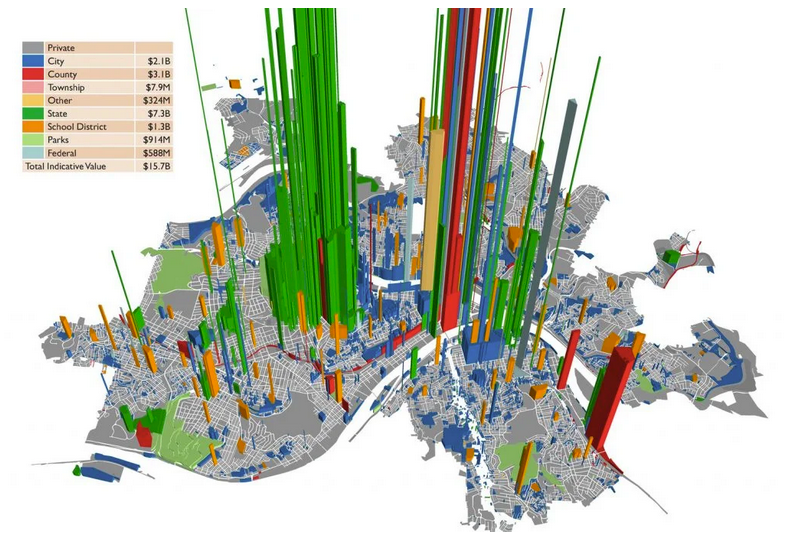
However, the fact still remains that sewer, road and electrical expansion is a drain on the tax payers for a given district. Taking all of that into account the people at Urban3 have always thought about land development as return on investment.
There thought is rather than dole out tax incentives that will prioritize large parking lots, box stores, and developments on the edge of civilization, we should focus on densifying where people live and thrive.
Getting the data
Much like lots of projects I take on it starts with a weird data format. Today's format is Microsoft Access database... 😅
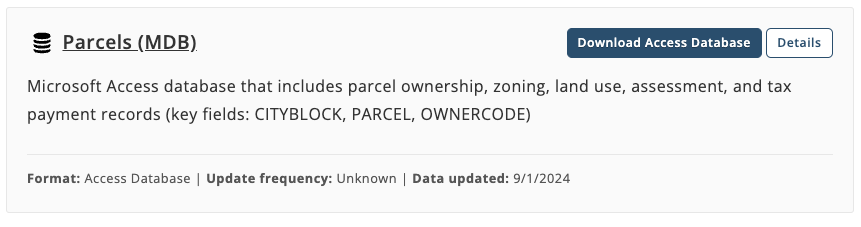
While it is not my favorite I was able to convert it to a Sqlite database after about 20 minutes messing around with it and find the data that I was looking for. We just needed to do a couple of things to extract the data.
- Find the latest year for that property
- Create a full address field
- Add owner name
- Calculate the tax area (Total Taxable / Parcel Area)
SELECT
p.Handle,
p.Parcel,
p.AsrParcelId,
p.ParcelId,
p.OwnerName,
concat(p.LowAddrNum, '-', p.HighAddrNum, ' ', p.StPreDir, '', p.StName,' ', p.StType) AS address,
sum(pra.TaxAmt) TaxAmt,
sum(pra.LandValue) LandValue ,
sum(p.LandArea) LandArea,
p.TaxAmt / p.LandArea as tax_area
FROM (
SELECT *
from PrclRear pr
where pr.BillYear IN (select max(pr.BillYear) from PrclREAR pr)
)  pra
JOIN Prcl p ON p.AsrParcelId = pra.AsrParcelId
GROUP BY p.Handle
ORDER BY pra.TaxAmt / p.LandArea, pra.BillYear
;
Add geometry to data
Once we have all of the data exported from the sql database we are able to associate it with the parcels shapefile fount on the St Louis open data portal.
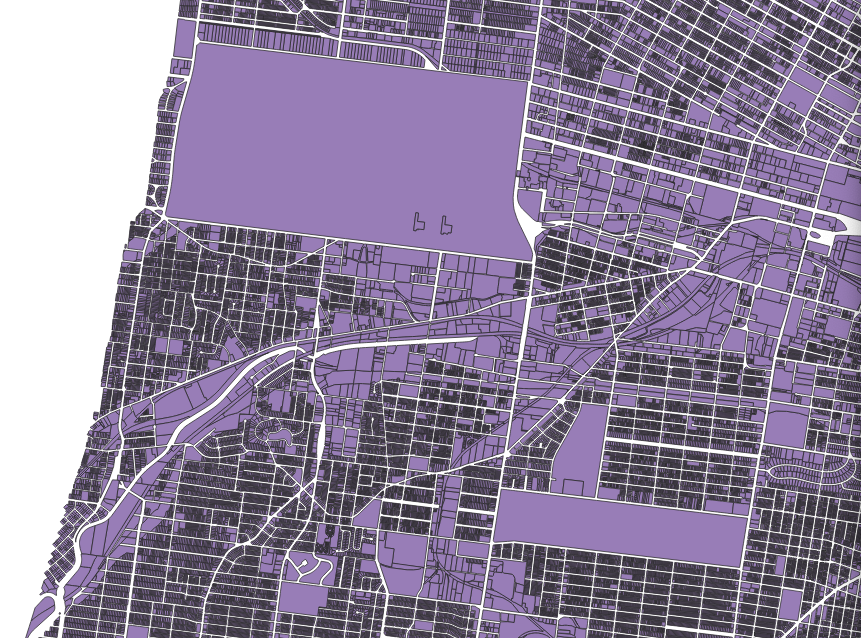
While we could just perform a join on the "handle" field in both the shapefile and csv exported the performance of loading all that geometry would be very intensive for the browser.
Knowing this I opted to add in lat and lon fields of the center of each parcel. Once that is done I was able to export this as a csv file.
Since we have created a csv file that has xy coordinates we can then begin mapping.
Creating a web map
While I don't want to go in depth in how I developed this you can take a look at the code here
I made a quick map with react map gl and deck.gl to create a quick mapbox map that loads in that csv file and visualizes that data by grouping the xy coordinates together using the H3 hex method
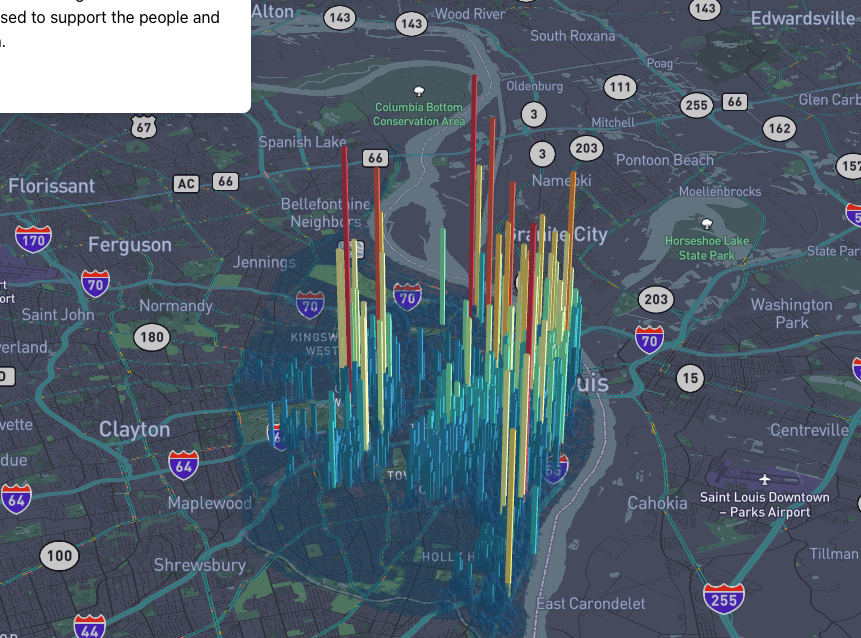
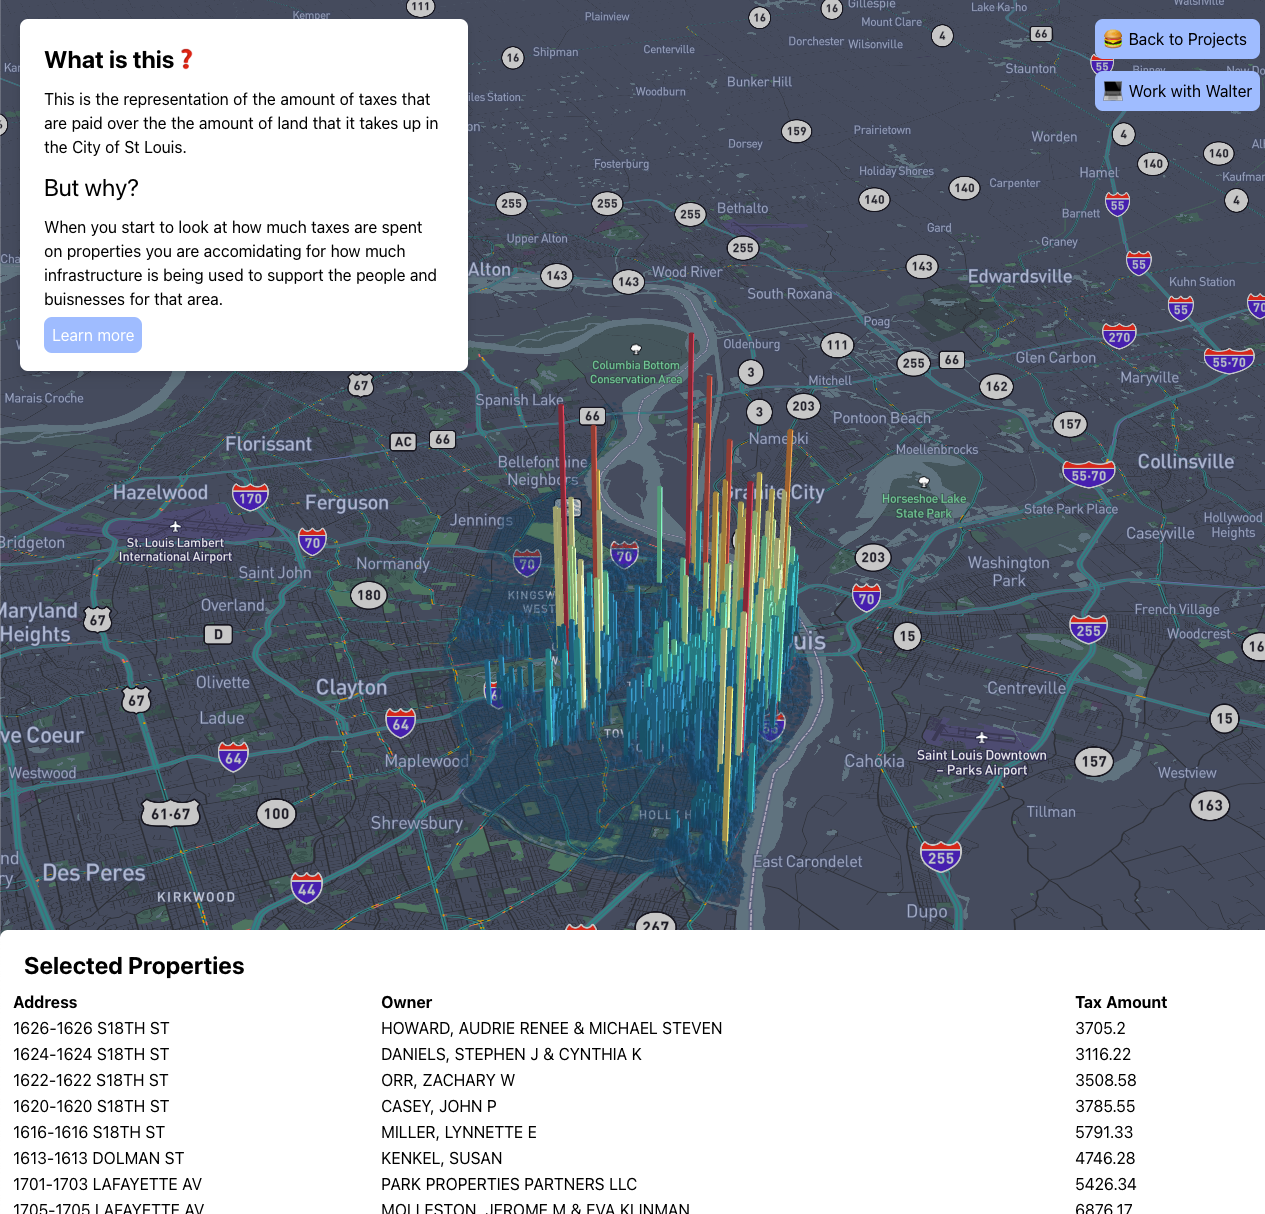
Exposing clicked properties
The immediate question after I posted this was "What is the tallest?". Not wanting to answer all of the questions I opted to just make a simple table that allows you to click the bars on the map and display them in a table.
Since there are many addresses for each bar this allows the user to be able to:
- Load the page fast
- Understand where we are making money on our land developments
- Dive into what properties are attributing to good and bad outcomes